Share this post
Award-winning practice management trusted by more than 10,000 accounting firms
For everything to be on one platform, it’s huge. It costs us less money too. Having everything centralized in TaxDome helps us, and it helps the client.

Accounting workflows can be complex. They involve multiple steps, each of which must happen in the right order and in a specific way. To ensure consistency at scale, these steps must be communicated clearly.
This is where accounting flowcharts come in handy. A flowchart is essentially a visual diagram that represents a process. They help accounting practices standardize workflows, leading to improved accuracy, efficiency, and compliance.
In this guide, we’ll explore why accounting flowcharts are so powerful. We’ll look at their key benefits and components, as well as some best practices for creating effective flowcharts in your firm.
What is an accounting flowchart?
An accounting flowchart is a visual diagram that represents an accounting workflow. Instead of describing processes using traditional word-based instructions, flowcharts use graphical images, arrows, and symbols to map out the steps of a process.
Accounting flowcharts make it easier for accountants to understand financial processes. They simplify the complex, breaking down intricate workflows into clear, logical steps. They also allow accountants to visualize entire workflows in one view — something that traditional instructors cannot do.
Benefits of using accounting flowcharts
Accounting flowcharts can be a game-changer for firms looking to improve efficiency and transparency. In this section, we’ll break down the key advantages of using flowcharts in your practice.
Simplify complex accounting processes
Accounting workflows can be hard to define or describe, even to experienced accountants. Flowcharts help by transforming complex workflows into clear, digestible steps.
What’s more, about two-thirds of people are thought to be visual learners. Using flowcharts and diagrams makes it easier for team members to understand and follow intricate processes.
Promote clear communication
Accounting flowcharts use a kind of visual language that is universally understood. As a result, they eliminate the ambiguity that can lead to misunderstandings, confusion, and accounting errors. The result is a shared reference point for training, implementation, and compliance.
Contrast this with someone explaining an accounting workflow via a training session. The potential for misinterpretation or unclear explanations is huge. Written instructions aren’t much better either. Without a visual element, it’s much harder to retain the information or reference it later on.
Reduce errors and inefficiencies
By mapping out entire workflows, your team gets a complete, top-down view of complex processes. This allows you to quickly identify potential risks and bottlenecks — and address them promptly. In this respect, accounting flowcharts double as quality control tools.
But that’s not all. Once you’ve closed any gaps and removed any inefficiencies, your flowchart helps avoid future errors by providing a standardized set of steps that are easy to follow.
Save time and resources
Accounting flowcharts save you valuable time. Instead of wasting hours explaining workflows to new hires, you have a simple chart that accountants can return to whenever they want. As a result, you can onboard staff faster and more effectively.
Moreover, flowcharts ensure that all accountants are following the same steps in any given workflow. Your staff can take the fastest, most efficient route to any outcome. This saves your firm a significant amount of time and money in the long run.
Key components of an accounting flowchart
Accounting flowcharts use shapes and symbols to represent different actions or aspects of a workflow. These form a universal visual language that everyone can understand. Here are the most important and commonly used flowchart symbols you need to know:

Now, let’s explore what each one means in more detail.
Start/end oval
Often referred to as a “terminal symbol”, an oval represents the start or end of an accounting process flowchart.

Process/action rectangle
In a flowchart diagram, a rectangle symbolizes a process or an action that must be taken. Within the context of an accounting workflow, a rectangle could represent an individual task or step. For example, in a tax preparation workflow, a rectangle could represent “gather client documents” or “file Form 1040 with the IRS”.
In a broader workflow, it could represent an entire accounting process. For example, in a tax compliance workflow, a rectangle could represent “corporate tax preparation and filing” and all the individual steps that the accounting process comprises.

Decision diamond
A diamond shape indicates a point where a decision must be made. The decision — for example a “yes” or a “no” — determines the next steps in the workflow. When diamonds are used, workflows split into two or more potential paths, depending on the decision or outcome.

Input/output parallelogram
A parallelogram represents data or physical items entering or leaving the workflow. In the context of accounting, it could be used when bank statements are gathered from a client (input) or when an accountant generates a financial report (output).

Manual input symbol
This symbol represents a step or task that requires an accountant to manually enter some data into a system. In modern accounting firms, most manual data entry steps are automated. That said, there still may be occasions where manual input is required — for example, signing off on a payment order.

Document symbol
As the name suggests, this symbol is used when a step in a workflow produces or requires a document. For example, this could be used when an invoice, financial report, or purchase order is used or created.

Delay Shape
You can use the delay shape anytime there is an expected delay built into the workflow. For example, you could use this symbol to represent the time spent waiting for a client to submit documents, or the time between submitting an invoice and getting paid.

Accounting flowchart examples
Now, let’s look at some real-life accounting flowcharts. In reality, your workflows will look different to these, depending on the size of your firm and how much of your workflows are automated.
Still, familiarizing yourself with these examples will help you understand how the symbols work in practice — as well as the level of detail you can go into for your own flowcharts.
Invoice processing
This accounting flowchart is a simple example that shows the most basic steps involved in invoice processing. It could serve as a solid starting point, enabling you to add additional steps as required.

Purchase order processing
This accounting flowchart for purchase order processing goes into more detail than the previous example. It shows how you can use diamond symbols to create different workflow branches, depending on different outcomes.

Accounts receivable
This bookkeeping flowchart shows a simple accounts receivable workflow. Most of the steps involved in this accounting process — from setting reminders to contacting clients — can be automated using practice management software such as TaxDome. Still, this accounting workflow chart would be useful for new starters in your accounts department.

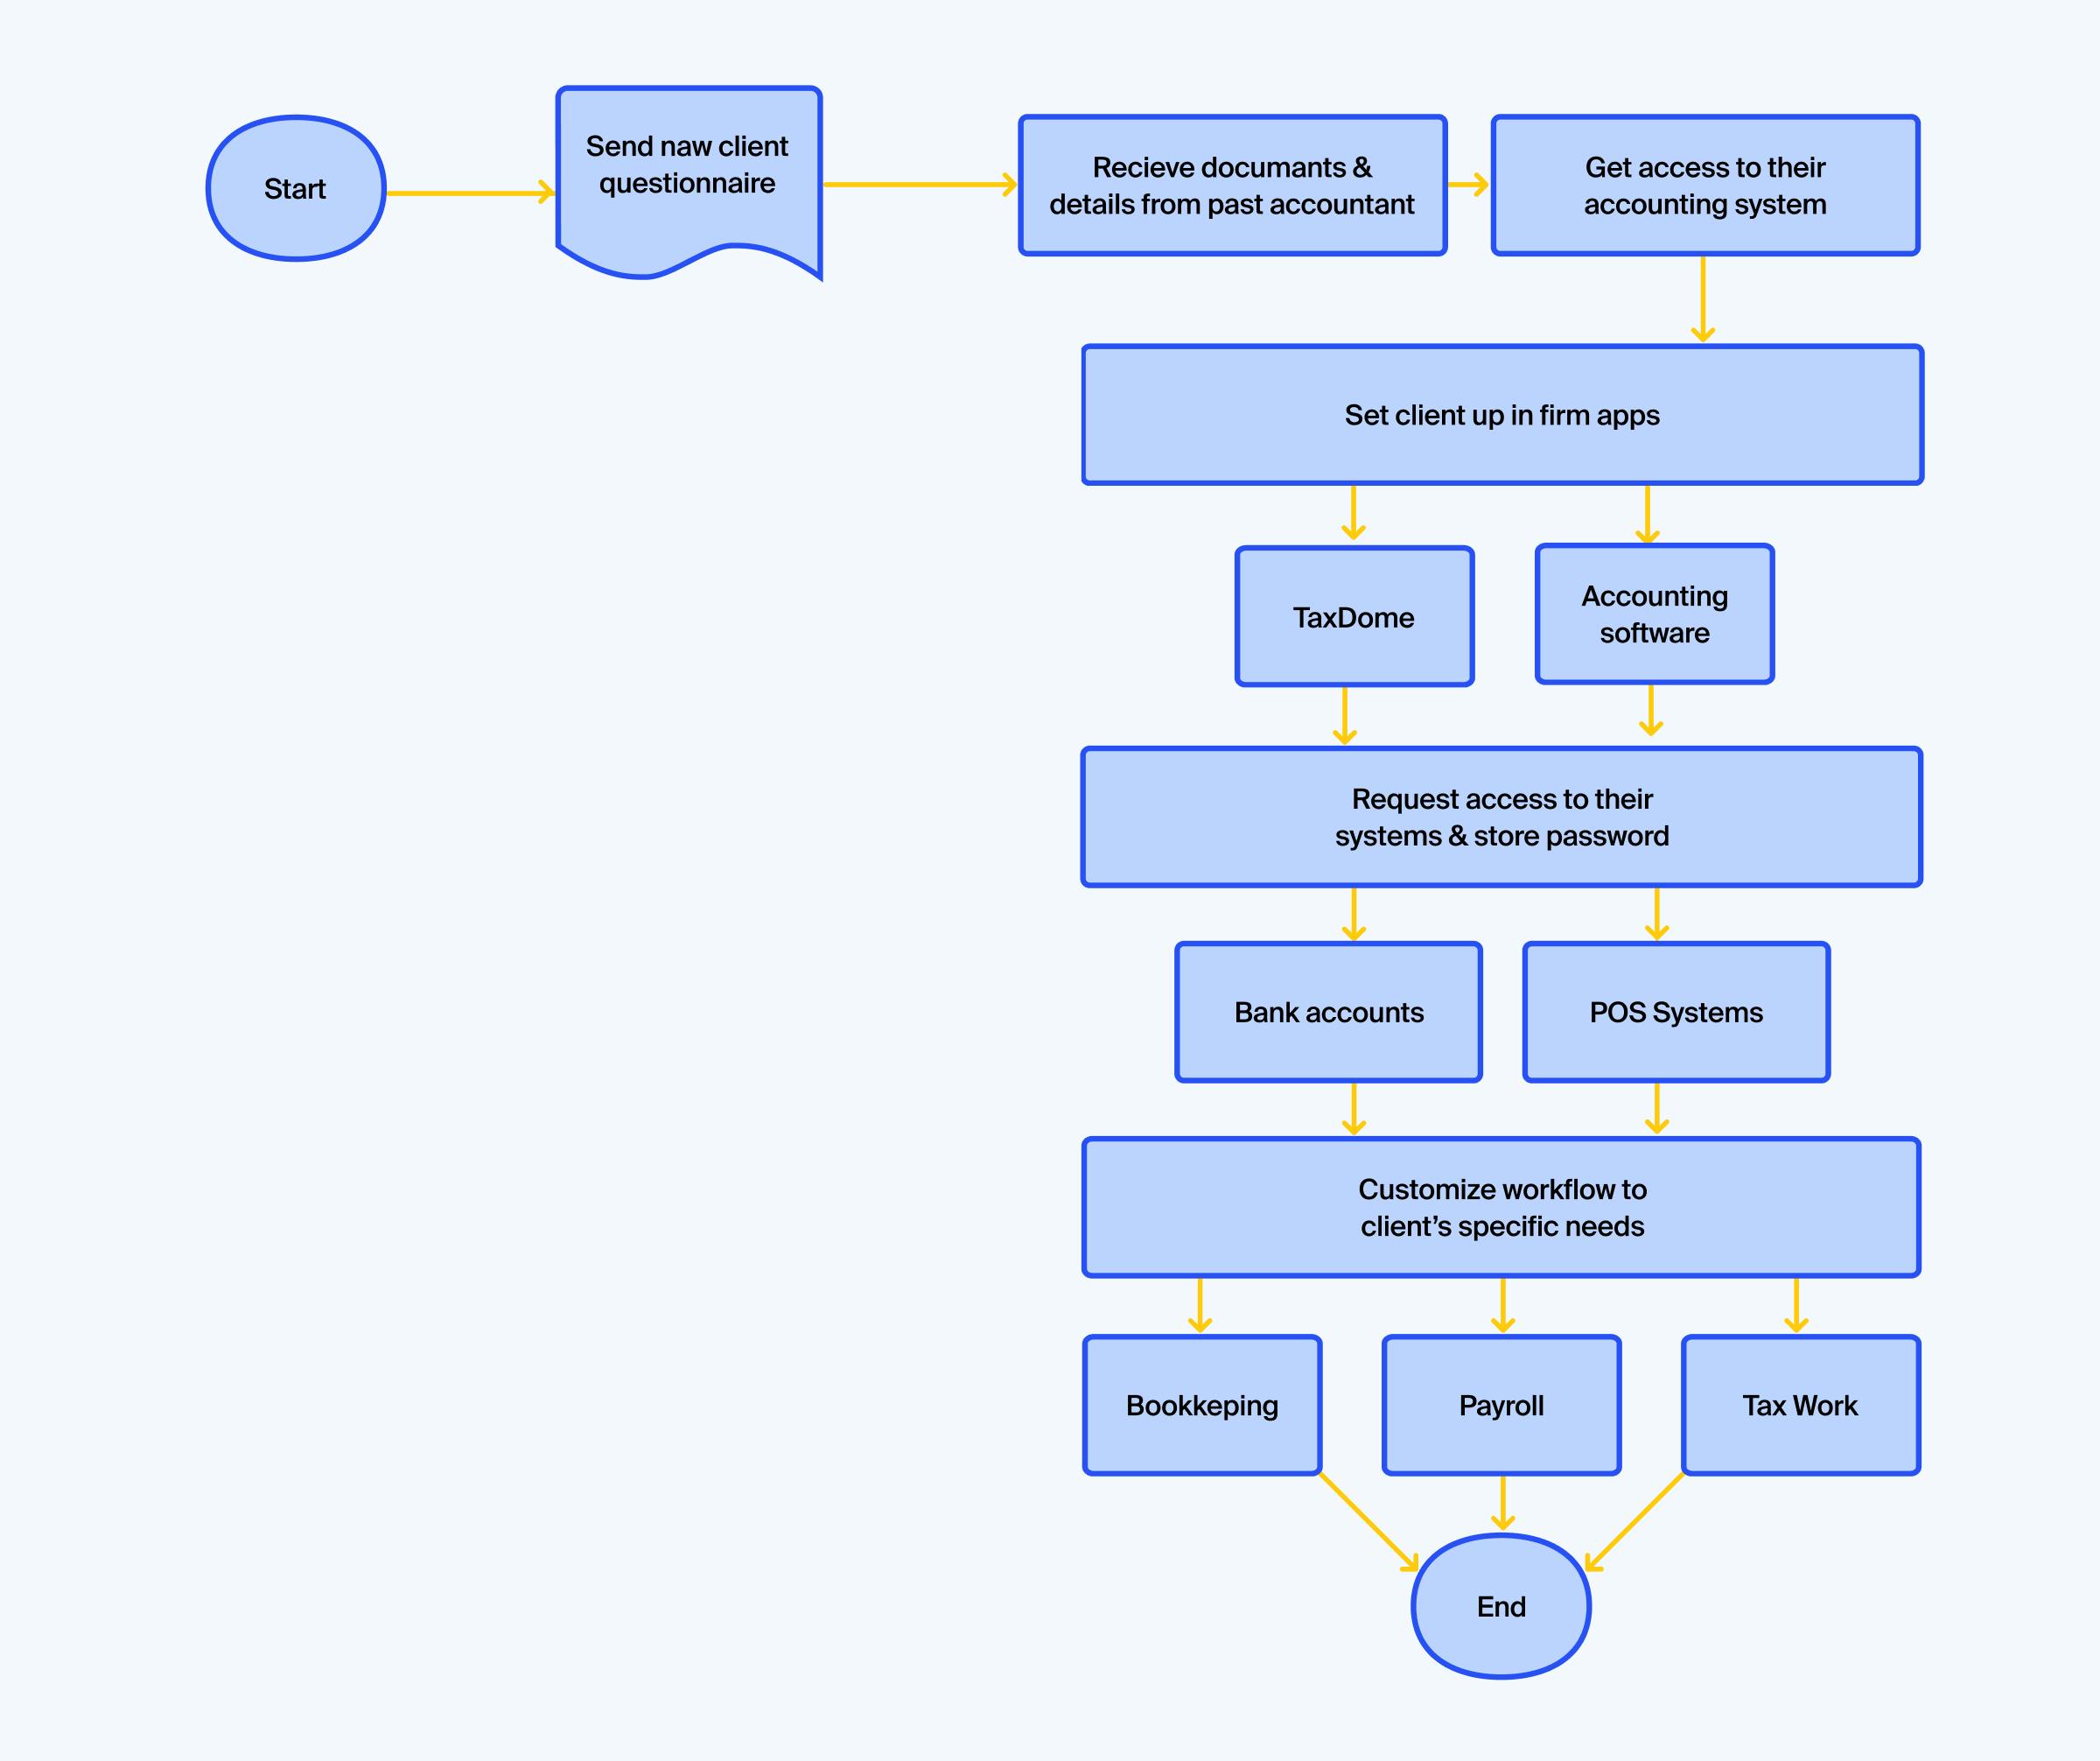
Client onboarding
While client onboarding varies from firm to firm, this accounting flowchart shows what a standard process could look like. Again, with a modern practice management platform like TaxDome, steps such as sending questionnaires and client communication can be automated entirely.
Payroll processing
Again, most of the steps in this payroll flowchart can be automated using modern accounting software. Still, this is a handy way for accountants to understand the steps involved in the payroll process.

Best practices for effective accounting flowcharts
To work effectively, accounting flowcharts must be easy to understand, relevant, and up to date. In this section, we’ll look at some best practices for ensuring flowchart success in your firm.
- Keep it simple. When it comes to flowcharts, the simpler the better. Focus on reducing a workflow down to its essential steps — and then communicating those steps as clearly and concisely as possible.
- Update regularly. Your accounting workflows will evolve as regulations, best practices, and technologies change. Make sure you update them in line with these changes to ensure they are relevant and accurate.
- Make it a team effort. When building your flowcharts, be sure to involve team members who know those workflows best. Include input from different departments and levels of seniority to ensure that you haven’t missed anything important.
- Test for clarity. Before you finalize a flowchart, make sure you test it thoroughly. For example, you could ask someone unfamiliar with the process to review it. If they can understand the process clearly, your accounting flowchart is good to go. If they can’t, you’ll need to go back to the drawing board.
- Embed into workflows. Once your flowcharts are ready, it’s time to embed them into key workflows. For example, you can make them a part of your onboarding training. Also, make sure they are easily accessible, so team members can reference them whenever they need.
Streamline your processes with TaxDome’s workflow automation
Accounting flowcharts are just one of the ways you can increase efficiency, transparency, and accuracy in your accounting practice. To truly take your business to the next level, you need the right technology — like TaxDome.
Our award-winning practice management software combines all the tools you need to run a high-performing, forward-thinking accounting firm. With TaxDome, you can:
- Create automated workflows that eliminate repetitive manual tasks
- Empower your team with a range of task management and collaboration tools
- Securely manage documents, e-signatures, client data, and billing
- Provide an incredible client experience with a custom-branded client portal and mobile app
- Standardize processes and save time with a library of customizable templates
In other words, TaxDome takes your firm to new heights by empowering you to work smarter. Ready to give it a try?
Automate your workflows and grow your firm with TaxDome — the most comprehensive practice management platform for accountants.
Request demo

Nicholas Edwards
As a content writer for TaxDome, Nicholas combines a deep understanding of accounting processes with a passion for technology. With years of experience in the accounting industry, he enjoys transforming complex financial and tax concepts into accessible, actionable insights. His writing helps accountants and firms leverage technology to streamline workflows and optimize their practices.

Thank you! The eBook has been sent to your email. Enjoy your copy.
There was an error processing your request. Please try again later.
Discover how top accounting firms are staying ahead in 2025 – download the free guide
What makes the best accounting firms thrive while others struggle to keep up? We analyzed our top 20 TaxDome firms, representing over $100M in combined revenue, to uncover the strategies driving their success.


